


Geopath has amazing reports for members tracking mobility post Covid. What are your options if you aren’t a Geopath member?
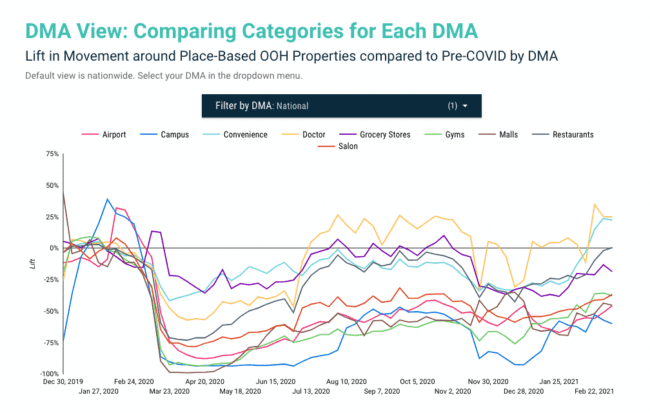
Ubimo’s Covid-19 dashboard shows trends in movement around Place based OOH properties. This chart, for example, shows that doctor visits and convienence store visits are above a pre covid baseline, restaurant visits are close to the baseline, most other categories are still below the pre-covid baseline.
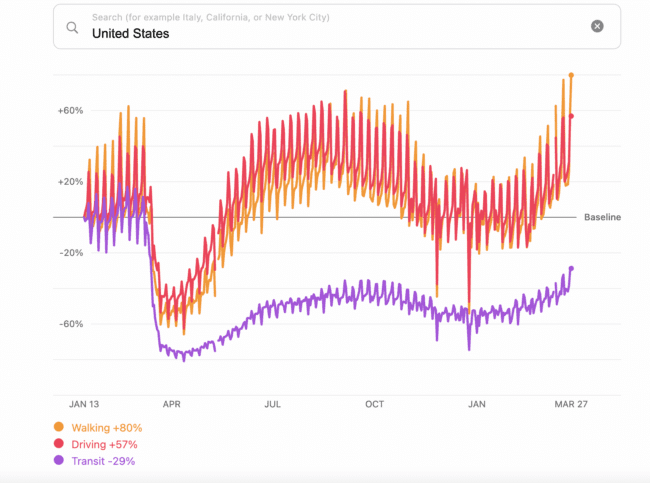
Want a simple big picture chart? Apple publishes a Mobility Trend Report updated daily based on requests for directions in Apple maps. The apple data shows walking and driving mapping requests are well above January 2020 (prior to covid). Transit requests have improved about halfway from the low point during covid but they are still down 29%. The Apple data allows you to search for mobility patters based on your state or your city as well.
Google’s mobility data shows overall trends by state as well as data on how visits have changed versus a pre-covid baseline. Here’s how total US visits have changed compared to a pre-covid baseline (source: Google US Mobility Report March 23, 2021)
Retail and recreation. -9%
Grocery and pharmacy. -4%
Parks. +9
Transit stations -31%
Workplaces. -30%
Residential. +8%
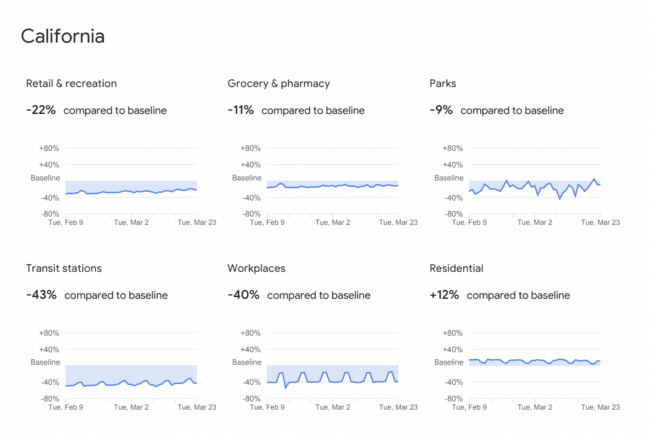
The google data also summarizes the data by state. Here’s what California looks like.
[wpforms id=”9787″]
Paid Advertisement


What are your options if you aren’t a Geopath member?
1- Become a Geopath member
2 – do something else that isn’t comparable with the rest of the OOH industry.
As an OOH buyer for 20+ years, I’m a bit of a fan of audience measurement currencies, so some bias here!