


With the largest reach of any media, OOH serves as a powerful marketing tool, especially for traditional brick-and-mortar and online retailers. The rapid growth of data analytics has further enhanced OOH’s ability to power retailers’ success by delivering ad messages to the intended target audiences through the most relevant OOH locations.
While this year’s back-to-school shopping season will be anything but traditional, OOH offers brands vibrant formats to help drive business in stores and online.
- OOH formats are almost always near the point of sale or transaction and frequently the last ads seen by consumers prior to a purchase. Over 75% of US adults report engaging with OOH ads.
- OOH outperforms mobile or mobile + desktop advertising in driving consumers to stores.
- When added to a media plan OOH increases the ROI of search by 40%, and it drives online activation better than all traditional media and banner ads.
- OOH prompts 66% of US adult travelers to take an action on their mobile device, including 42% who search and 32% who visit advertiser websites.
- Because OOH is the most favorably viewed type of consumer advertising, it builds awareness rapidly, and magnifies audience impressions through earned media, especially social media.
- OOH cannot be delayed, skipped, turned off, plus it produces the highest ad recall.
- Printed OOH offers 24/7 coverage, while digital OOH offers instantaneous message updates and as many changes as advertisers need.
- About 40% of US adults notice directional OOH ads, 20% of them have immediately visited a business after seeing the ad, and 74% of those visitors made a purchase. For digital OOH, the rate of purchase is over 80%.
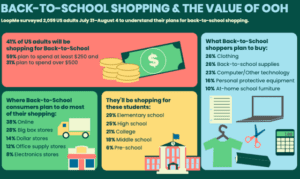
OAAA, in partnership with LoopMe, just completed a survey of over 2,000 US adults offering important insights on shoppers’ plans for this back-to-school season.
The OAAA Back-to-School infographic defines how OOH influences shoppers and summarizes these top-line survey findings:
- 41% of US adults will be shopping for Back-to-School
- 59% plan to spend at least $250 and 30% plan to spend over $500
What Back-to-School shoppers plan to buy:
- 26% Clothing
- 26% Back-to-school supplies
- 23% Computer/Other technology
- 16% Personal protective equipment
- 10% At-home school furniture
Where Back-to-School consumers plan to do most of their shopping:
- 38% Online
- 28% Big box stores
- 14% Dollar stores
- 12% Office supply stores
- 8% Electronics stores
The classification of students they’ll be shopping for:
- 29% Elementary school
- 25% High school
- 21% College
- 18% Middle school
- 6% Pre-school
Source: Benchmarketing, Cuebiq, Nielsen, LoopMe
[wpforms id=”9787″]
Paid Advertisement