 Brad Thomas writes for Seeking Alpha where he specializes in publicly-listed REITs. In addition, Thomas is the Editor of the Forbes Real Estate Investor, a monthly subscription-based newsletter.
Insider has followed Brad for some time and his take on OOH REITs is thoughtful and worth the read. Here is his take on Outfront Media. Insider thanks Brad for permission to reprint.
Summary
Billboards offer the most powerful impact of all outdoor advertising formats.
New York City is also a prime-time market for advertisers to display content on street furniture, buses, commuter rail, subways, and sports stadiums.
OUT sports a 7.4% dividend yield with a technology-based platform that is certain to add alpha.
This idea was discussed in more depth with members of my private investing community, Intelligent REIT Investor.
I began covering Outfront Media (OUT) over a year ago, and in my initial research report, I explained,
“I see value in OUT, as a means to benefit from the continued growth in the US economy. Specifically, I am bullish as it relates to OUT’s superior assets (in top markets) and hard-to-replicate portfolio. OUT’s assets are located in prime, iconic locations and the cell tower leasing business should be an extremely profitable extension of the business.”
There are a few ways to invest in billboards, within the REIT sector, as mentioned you can invest in OUT in addition to the direct peer, Lamar Advertising (LAMR). In addition, Landmark Infrastructure (LMRK) has around 20% of revenue generated from outdoor billboards (primarily ground leases).
Billboards offer the most powerful impact of all outdoor advertising formats, because they are located on key highways, intersections, and integral choke points throughout the U.S. These billboards provide messaging with long-term presence and tremendous visibility to vehicular traffic. Here’s a snapshot of the billboard asset components:
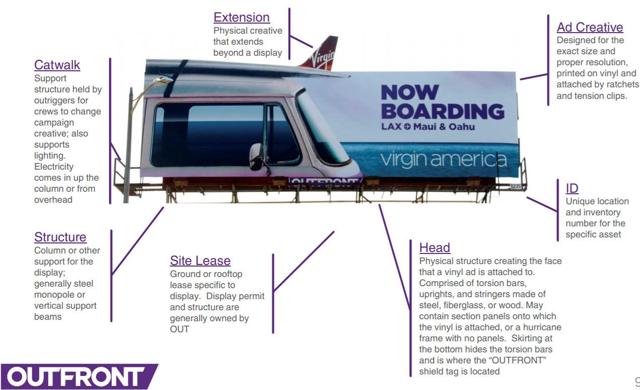
I have always been intrigued with the billboard business model, especially in New York City where billboards are an essential element of the real estate, as they tower above most all buildings in prime locations, making them almost impossible to ignore.
Billboards in New York City create buzz that in turn prompts the consumer to engage in a specific audience or direct them to the retailer’s front door (real or virtual). Well-placed digital media is a perfect conduit for consumers to engage through social and mobile integration and use apps more efficiently. New York City is also a prime-time market for advertisers to display content on street furniture, buses, commuter rail, subways and sports stadiums.
One of the unique ways that OUT is benefiting is the use of its proprietary technology solution called out-of-home (OOH), that provides marketers with additional data analytics and a proven way to close the loop with audiences.
 OUT has over 1,000 brands using its customized mobile ad delivery that can be targeted by market and demographic, allowing brands to pinpoint accurately who they need to reach, then reach them consistently – more than 20 times a day.
As location infiltrates all media formats, OOH remains the most established location-based expert. OOH’s targeted locations allow brands to maximize on the recency of messaging, prompting consumer purchases in that moment. Location is considered the best indicator of consumer intent.
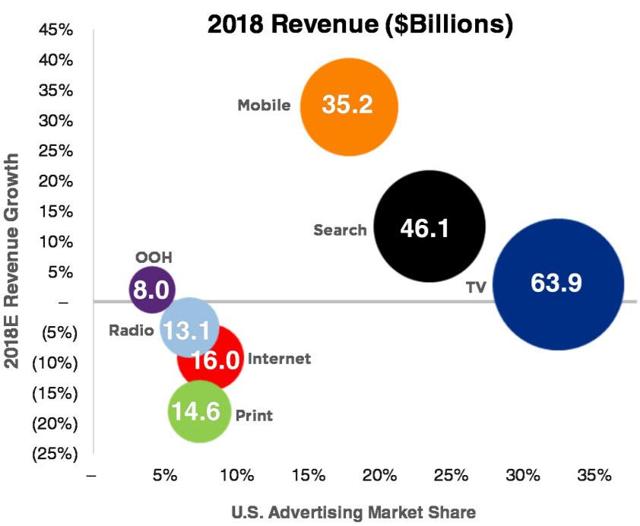
The OOH platform continues to hold and grow market shares simply because internet growth is fueled by mobile demand. Print is shrinking considerably and radio is constant, but the internet is the future. Data analytics a terrific way for billboard companies to take part in the digital revolution and another way for retailers to build successful omni-channel platforms.
So, while you may think of OUT as a billboard business, I consider the REIT more of a hybrid platform in which technology, retail, and advertising intersect.

The Billboard REIT
OUT is one of the largest out-of-home media companies in North America. The portfolio includes more than 400,000 digital and static displays, which are primarily located in the most iconic and high-traffic locations throughout the 25 largest markets in the U.S. The company went public (IPO) on March 28, 2014, and began operating as a REIT on July 17, 2014.
OUT is also the advertising partner of choice for major municipal transit systems, reaching millions of commuters daily in the largest U.S. cities. OUT has displays in over 150 markets across the U.S. and Canada. According to a white paper:
“OUTFRONT connects brands to their target audiences, nationwide. Whether that audience be the techy, the business executive, the hipster, or the mom, OUTFRONT has it covered. Customized audience packages ensure brands reach the right consumer, at the right time, with the right messaging.”
OUT owns the permit for each billboard location, and that provides the company with a competitive barrier to entry. OUT owns less than 10% of site locations; there are approximately 23,000 leases with 18,500 landlords (average eight-year life average). The majority of leases have abatement and/or termination clauses for market weakness and a small % have escalators.
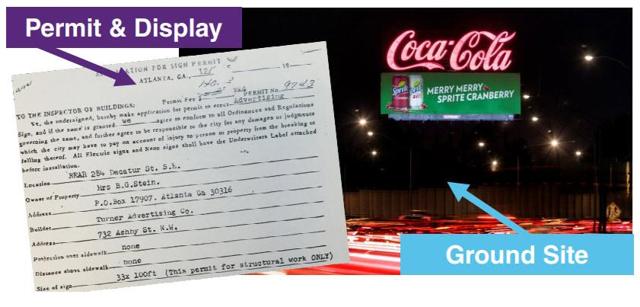
In addition to billboards, OUT rents out wallscapes affixed to buildings in heavily trafficked areas. These assets provide maximum impact for creative messages and are considered a great point-of-purchase exposure for creative districts. Wallscapes are perfect for penetrating urban centers and vary in size, providing endless creative options.
OUT’s transit franchise assets also provide complementary value to the billboard business in urban/suburban markets. Buses serve as “rolling billboards” traveling in and around densely populated city streets, leaving a lasting impact on pedestrians, motorists, and passengers. Eye-level bus exterior ads provide maximum exposure for customers.
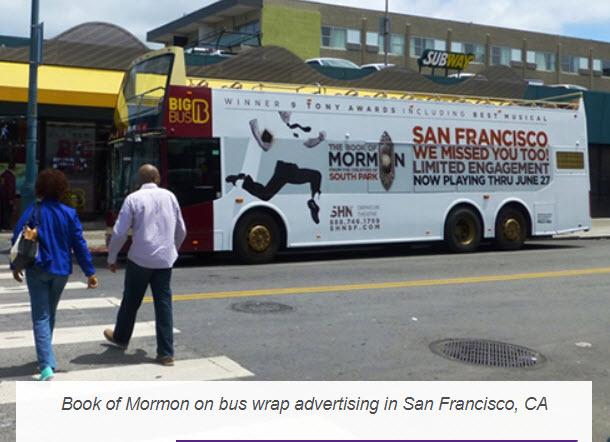
Rail exterior also makes a huge impact, influenced by riders, onlookers, vehicular traffic alike, as they are waiting for the train to arrive or alongside major highways. Rail reaches a captive audience on their average 40-minute commute each way.
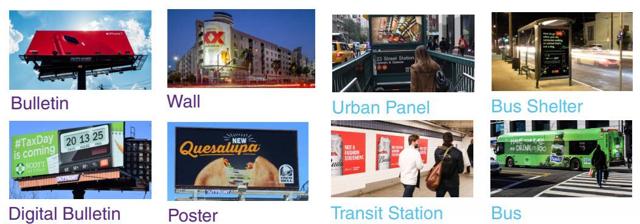
Digital brings numerous benefits to advertisers, it adds an extra layer of timeliness and relevance, and messaging can be easily changed. Here is a breakdown of OUT’s assets, based on billboards and other:
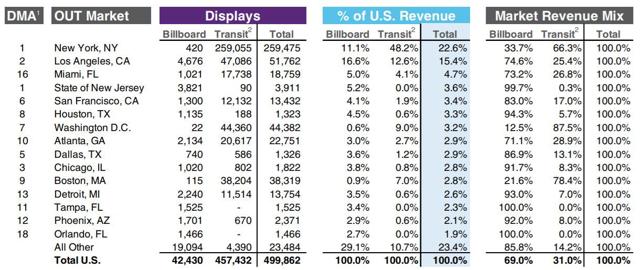
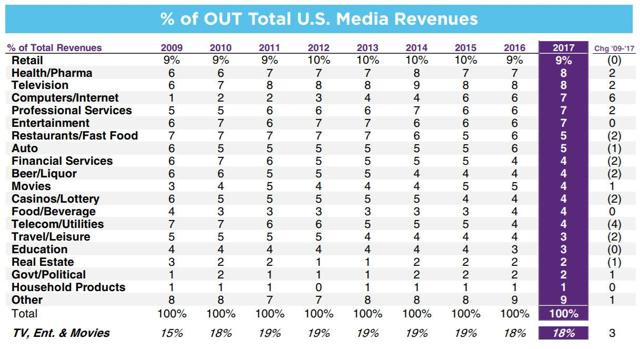
As you can see, New York City represents 22.6% of total revenue, followed by LA (15.4%) and Washington, DC (4.7%). OUT is also diversified by industry, as illustrated below:
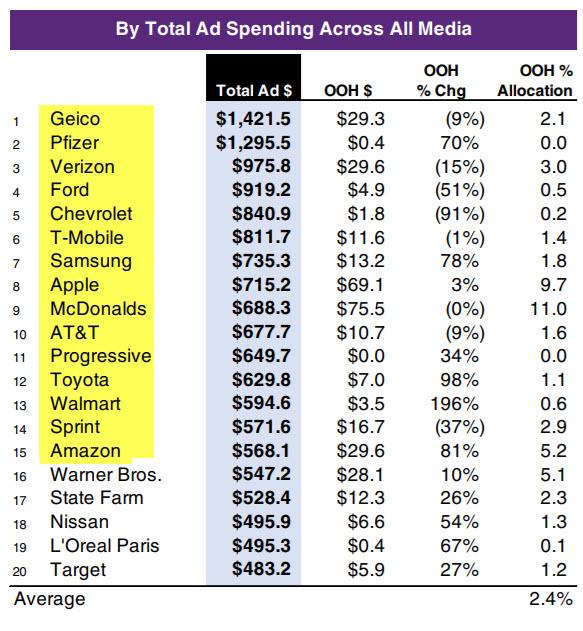
Here is a snapshot of OUT’s Top 20 Advertisers based on “ad spending across all media”. As you see, the list includes many companies that investors have in their stock portfolio, including Geico, Pfizer (NYSE:PFE), Verizon (NYSE:VZ), Ford (NYSE:F), Chevrolet (NYSE:GM), Apple (NASDAQ:AAPL), McDonald’s (NYSE:MCD), AT&T (NYSE:T), Walmart (NYSE:WMT), and Amazon (NASDAQ:AMZN).
The Growth Strategy
As you can see below, OUT has four growth drivers:
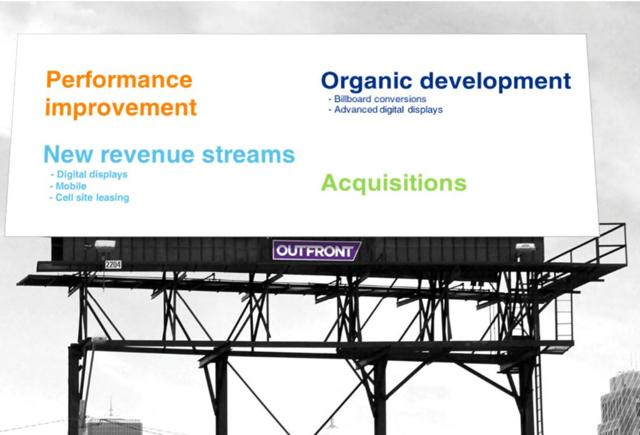
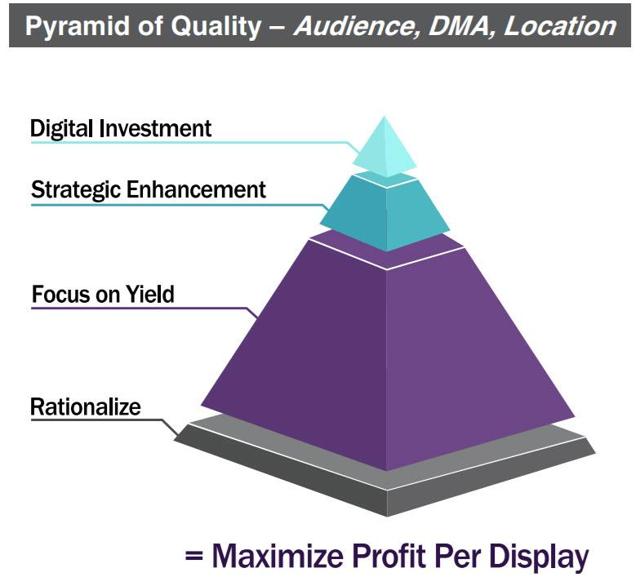
OUT invests in key strategic locations (high traffic areas, transit centers, retail districts, and iconic locations). The company’s sales and operational incentives are aligned to maximize yield and profitability.
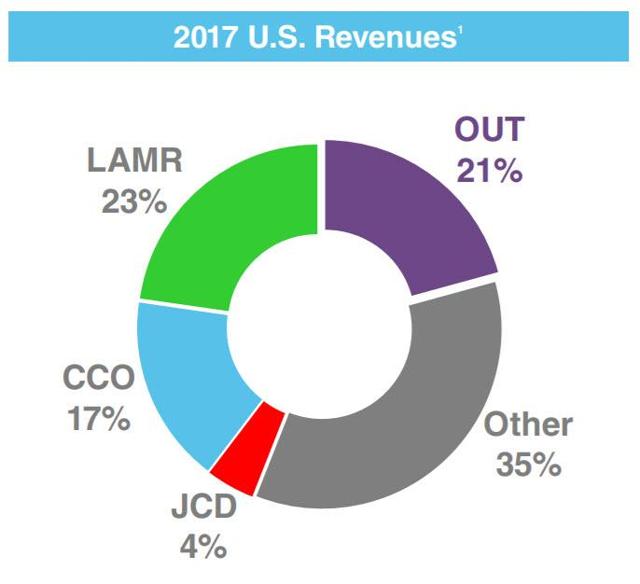
The US market is highly fragmented, as illustrated below:
One way to drive growth is by leasing out space on wireless carriers. OUT has 25,000 potential sites and each site could hold 1-3 carriers.
Wireless provides OUT with recurring, monthly rent under long-term lease contracts with no capital expenditures required. The carriers are responsible for providing backhaul. The biggest catalyst for OUT is to create unique products and processes to drive media allocation.
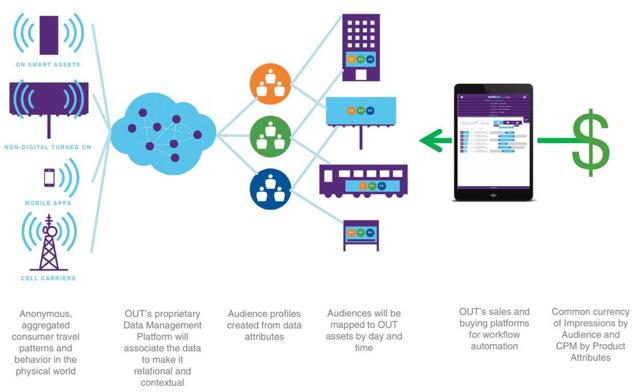
OUT Mobile is an ad tied platform that serves consumers within a geo-fenced area. This platform was launched in Q4-15 and drives strong secondary action rates.
Consumers’ travel patterns and behavior are represented in various formats (smartphones, billboards, mobile apps, ad cell carriers). OUT’s proprietary data management platform will associate the data to make it relational and contextual. Audiences will be mapped to OUT’s assets by day and time.
The Balance Sheet
Here’s a snapshot of OUT’s balance sheet:
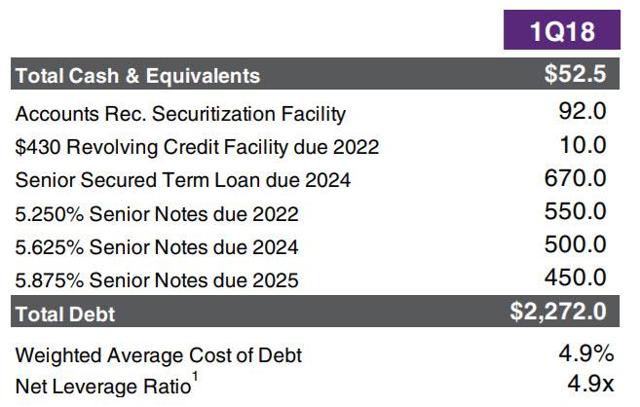
At the end of Q1-18, OUT’s liquidity position was $384 million, including $52.5 million of cash and $331.5 million of availability on the $430 million revolving credit facility (net of outstanding letters of credit) and outstanding balance of $10 million.
An additional source of liability is OUT’s $300 million at the market (or ATM) equity offering program (put in place in November). There was no timeline or usage requirements on the ATM, and no shares have been issued to date.
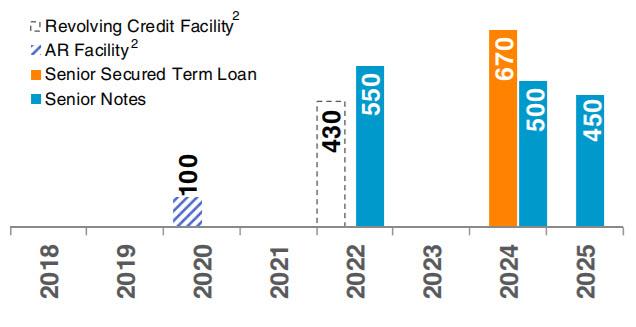
OUT’s net leverage ratio at Q1-18 was 4.9x, up slightly from last quarter. The company is focused on its goal to reduce this to its long-standing target range of 3.5 to 4x, which will be achieved through growth in OIBDA and debt paydown. OUT and Lamar Advertising (LAMR) are both rated BB- by S&P.
More Clarity Is Positive
In October 2017, I explained that the “MTA deal is finalized, there is more clarity as it relates to OUT’s earnings stream – the forward runway (2018 AFFO/share forecast) is 13%.”
I was referring to New York OUT’s long-term deal with New York Metropolitan Transportation Authority (or MTA), the largest public transit authority in the country. The deal from the MTA gives OUT the ad and communications concessions for subway, commuter rail and buses along with billboards.
In 2017, OUT announced that it had solidified the contract, and the billboard REIT will deploy more than 50,000 digital ad displays system-wide, installed on a rolling basis starting next year. It will also continue maintaining more than 500 billboard locations for the MTA.
On the recent earnings call, OUT’s CEO, Jeremy Male, explained,
“We’re pleased with the results we’re seeing in our digital portfolio and this is important in the context of other digital deployments, particularly in New York MTA. You’ll recall from last September’s conference call on the MTA that we expect our revenue to double over a 10-year period.”
He went on to say,
“I am feeling good about 2018, our billboard revenue which is the largest growth engine in the company is improving, local continues to demonstrate growth.
The uncertainty of winning the MTA contract is behind us, and we’re working closely with the MTA on the launch plans for later this year. Our digital assets are performing well and will be an increasing growth driver for the business, and we’ve also added San Francisco to our transit growth story.”
During the Q-18, OUT’s digital was 15.5% of total revenues, up from 12.6% in the same quarter last year. But the transformation of the business continues as expected with digital revenues as an underlying driver and an increase in percentage of the total business.
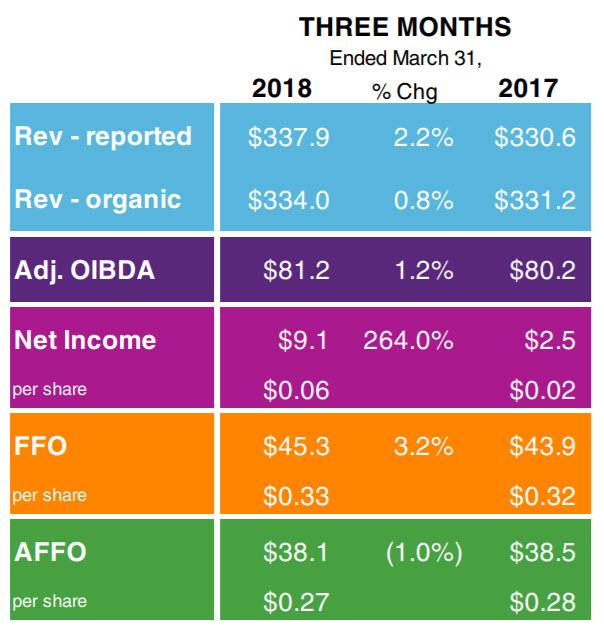
In Q1-18, OUT’s key operating and cash flow metrics were in line with expectations with OIBDA up 1.2% and AFFO down 1%.
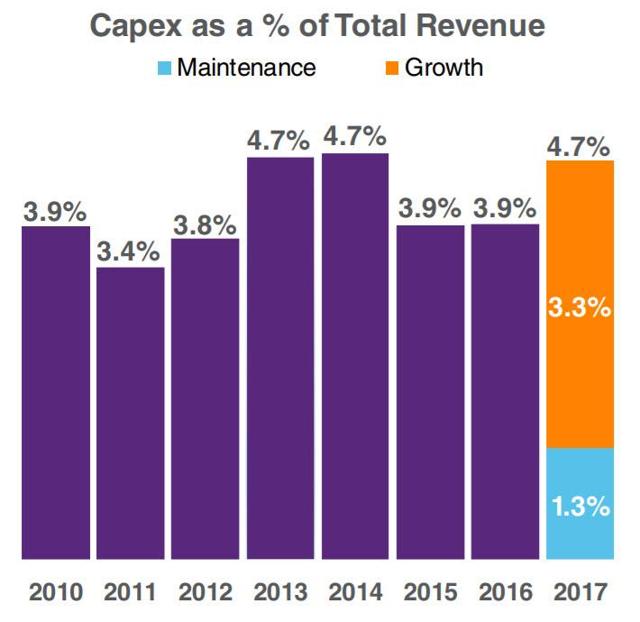
For 2018, guidance for capital expenditures was unchanged at $75 million with maintenance at $20 million to $25 million and growth at $50 million to $55 million.
Note: This 2018 capex guidance does not include the deployment of digital displays under the new MTA transit agreement in New York. This is because the assets will ultimately belong to the MTA, so the spending is not accounted for or categorized as capex or a part of property plant equipment.
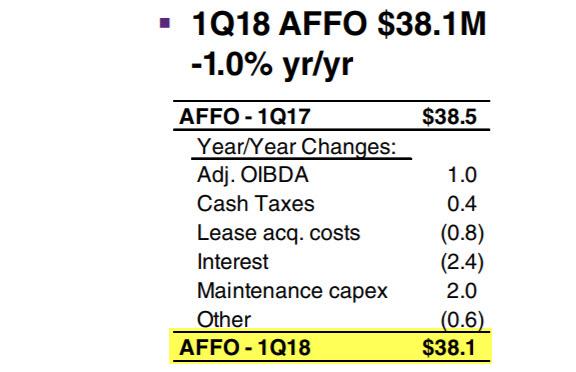
One of the key drivers of the slight decline in AFFO this quarter was higher interest expense. This has caused higher outstanding debt balances and rising interest rates that impact a third of OUT’s debt structure as well as from increased letter of credit fees arising from the new MTA contract.
OUT expects continued improvement in advertising, especially on billboards to increase the AFFO growth rate and drive the company to the previously announced guidance of low to mid-single digit growth for the year.
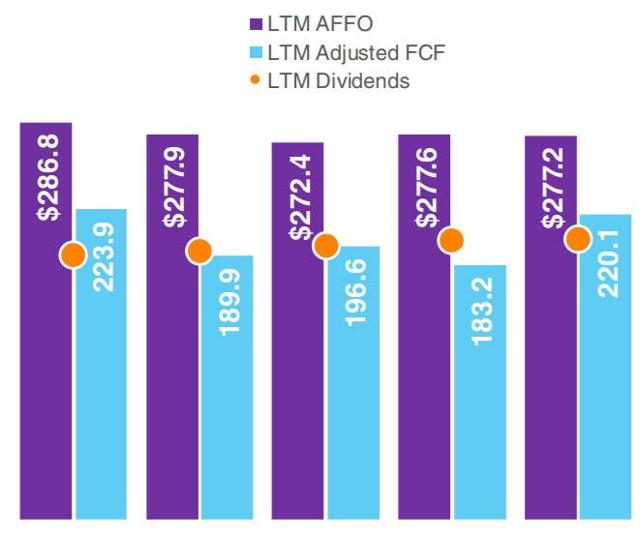
The chart below shows OUT’s last 12 months AFFO of $277.2 million and a dividend payout ratio of 73%, which is also the average dividend payout of the major publicly traded REITs. OUT’s adjusted free cash flow payout ratio was 92%.
This is a significant sequential improvement from the company’s LTM coverage in Q4-17,
Note that adjusted free cash flow excludes MTA equipment deployment costs from free cash flow calculation in order to provide a better understanding of the true cash flow of the underlying business.
On April 25th, OUT’s board approved a quarterly cash dividend of $0.36 per share payable on June 29, to shareholders of record of the close of business on June 8.
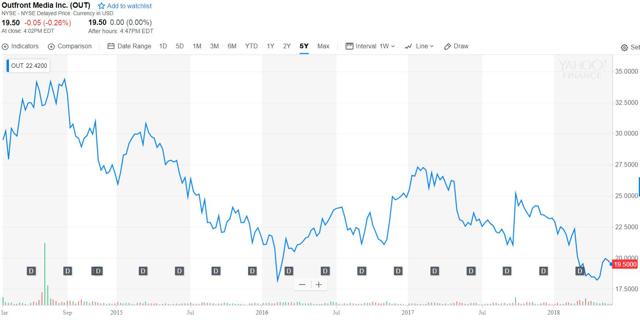
Why Is OUT So Cheap?
As you can see below, OUT has traded down over the last 5 years:
As evidenced by the snapshot below, OUT is still underestimated when compared with other REITs:
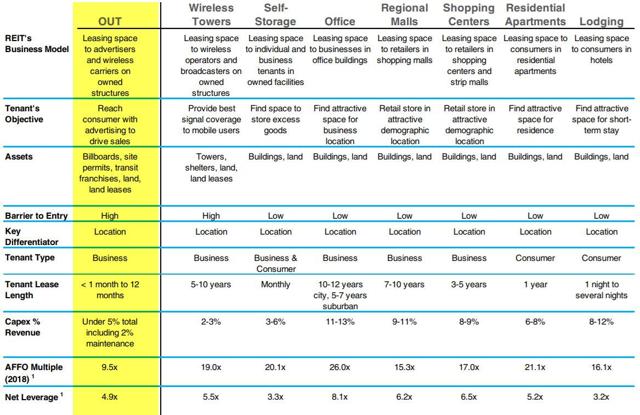
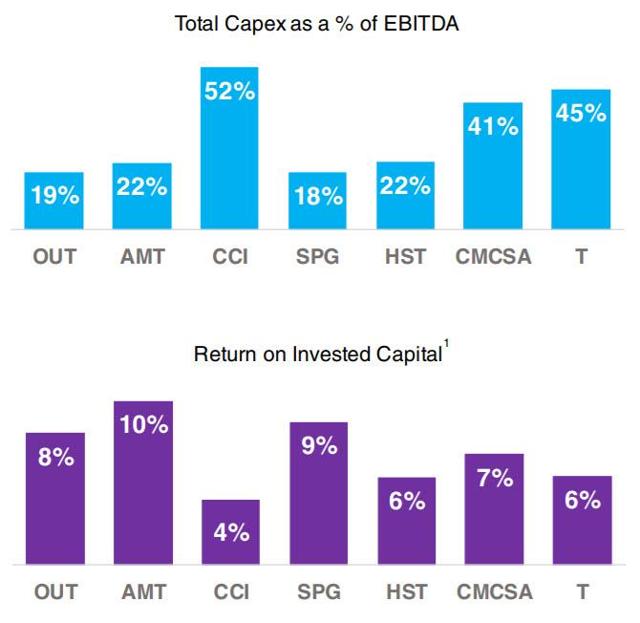
More specifically, OUT’s capex as a percentage of revenue is less than 5% (including maintenance). That is much lower than office (11-13%), malls (9-11%), shopping centers (8-9%), or lodging (8-12%). A snapshot of OUT’s low capex model:
Here’s how OUT compares to larger REITs and media/telecom companies:
Risks to Consider…
OUT (and LAMR) are also in the ad business, and investors should recognize the erratic capex requirements associated with challenges to run an ad-based business.
In addition to the capex concerns, the business model does not provide the income sustainability warranted by other property sectors (due to the fluctuating ad-based business). Also, states have passed billboard control statutes and regulations that are as restrictive as the federal requirements, including laws requiring the removal of illegal signs at the owner’s expense (and without compensation from the state).
This means that some of the underlying assets owned by OUT could be subject to uncontrollable risks (economic, governmental, and competitive) as well as declining revenues.
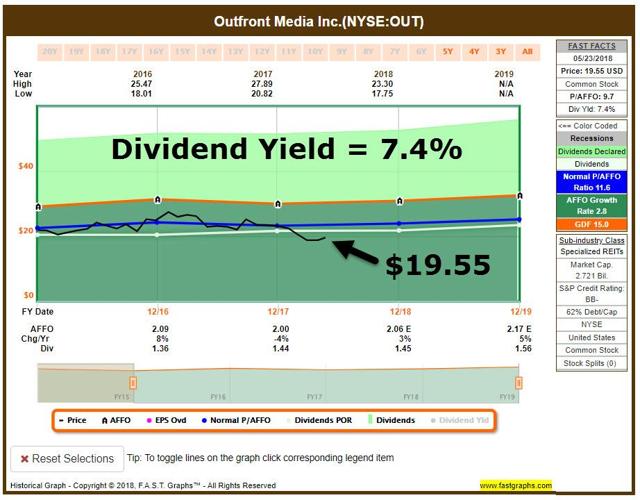
Nonetheless, OUT sports a 7.4% dividend yield with a technology-based platform that is certain to add alpha. As noted, there is now more clarity with the MTA contract, and the most attractive part of the business model is the fact that OUT enjoys an enviable list of high-quality advertisers. Debt concerns me somewhat (BB-), but I am more nervous about the impact when the next recession hits (I cover that topic in my upcoming newsletter, Forbes Real Estate Investor), which is nowhere in sight.
In closing, I am maintaining a BUY, and in the words of Ted Turner,
“Early To Bed, Early To Rise, Work Like Hell, And Advertise”
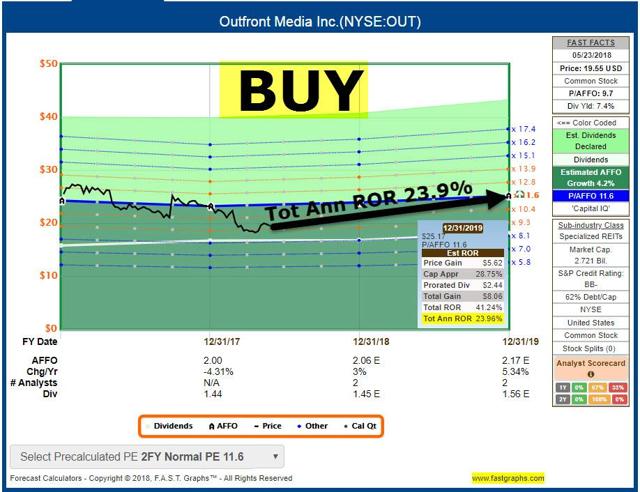
All Strong Buy picks can be viewed in my Marketplace service (The Intelligent REIT Investor).
Note: Brad Thomas is a Wall Street writer, and that means he is not always right with his predictions or recommendations. That also applies to his grammar. Please excuse any typos, and be assured that he will do his best to correct any errors, if they are overlooked.
Finally, this article is free, and the sole purpose for writing it is to assist with research, while also providing a forum for second-level thinking. If you have not followed him, please take five seconds and click his name above (top of the page).
Source: F.A.S.T. Graphs and OUT Investor Presentation.
Disclosure: I am/we are long ACC, AVB, BHR, BRX, BXMT, CCI, CHCT, CIO, CLDT, CONE, CORR, CTRE, CUBE, DEA, DLR, DOC, EPR, EXR, FRT, GEO, GMRE, GPT, HASI, HT, HTA, INN, IRET, IRM, JCAP, KIM, KRG, LADR, LAND, LMRK, LTC, MNR, NNN, NXRT, O, OFC, OHI, OUT, PEB, PEI, PK, PSB, PTTTS, QTS, REG, RHP, ROIC, SBRA, SKT, SPG, STAG, STOR, TCO, TRTX, UBA, UMH, UNIT, VER, VNQ, VTR, WPC.
I wrote this article myself, and it expresses my own opinions. I am not receiving compensation for it (other than from Seeking Alpha). I have no business relationship with any company whose stock is mentioned in this article.
Paid Advertisement
