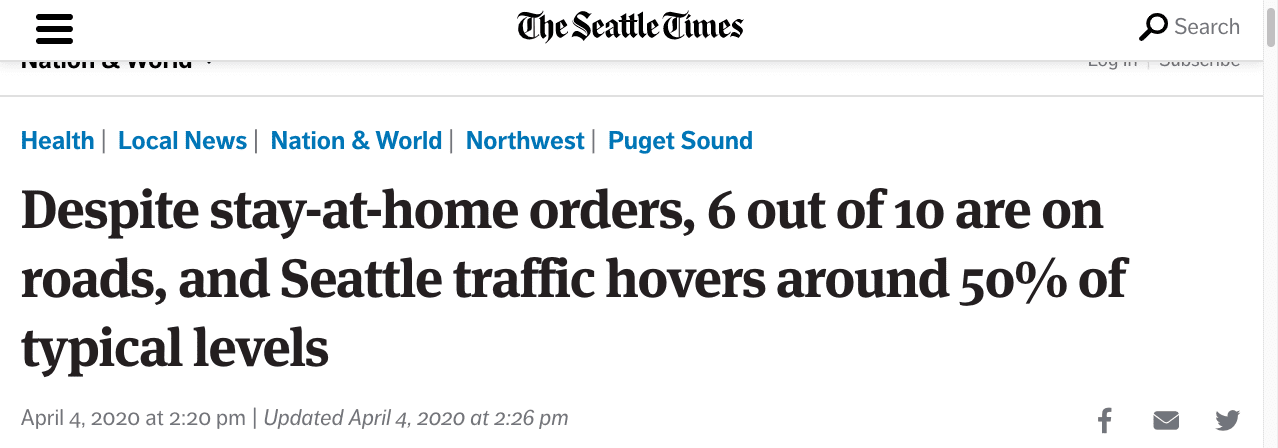
The headline from this April 4 Washington Post article reprinted by the Seattle Times says it all. Traffic is down but lots of people are still driving.
 There’s no shortage of data on driving patterns. Last week Adquick published an analysis of the coronavirus impact on travel based on a sample of 10% of US cell phone users in the United States which suggests that for the last week of March (when shelter at home orders were in place for much of the country) statewide traffic declined by a median 28%. The decline varied from a high of 42% in Nevada and a low of 18% in Utah in comparison to the period prior to the coronavirus. Here’s the state data.
- Alabama down 24%
- Arkansas down 24%
- Arizona down 28%
- California down 41%
- Colorado down 34%
- Connecticut down 34%
- Wash DC down 41%
- Florida down 30%
- Georgia down 28%
- Iowa down 26%
- Illinois down 35%
- Indiana down 26%
- Kansas down 19%
- Kentucky down 26%
- Louisiana down 31%
- Massachusetts down 33%
- Maryland down 23%
- Maine down 37%
- Michigan down 38%
- Mnnesota down 33%
- Missouri down 21%
- Mississippi down 26%
- North Carolina down 28%
- North Dakota down 32%
- Nebraska down 24%
- New Mexico down 22%
- Nevada down 42%
- New York down 35%
- Ohio down 30%
- Oklahoma down 23%
- Oregon down 34%
- Pennsylvania down 33%
- Rhode Island down 39%
- South Carolina down 24%
- South Dakota down 20%
- Tennessee down 28%
- Texas down 29%
- Utah down 18%
- Virginia down 29%
- Vermont down 41%
- Washington down 39%
- Wisconsin down 31%
Metro area traffic is down 30-50%. Here are the Metro areas ranked from lowest to highest declines.
- Houston down 28%
- Atlanta down 30%
- Dallas-Fort Worth down 32%
- Philadelphia down 33%
- Boston down 33%
- Chicago down 36%
- New York down 35%
- Los Angeles down 38%
- Wash DC down 41%
- San Francisco down 51%
Insider will provide weekly updates from Adquick every Monday throughout the crisis to show you what traffic volumes are doing.
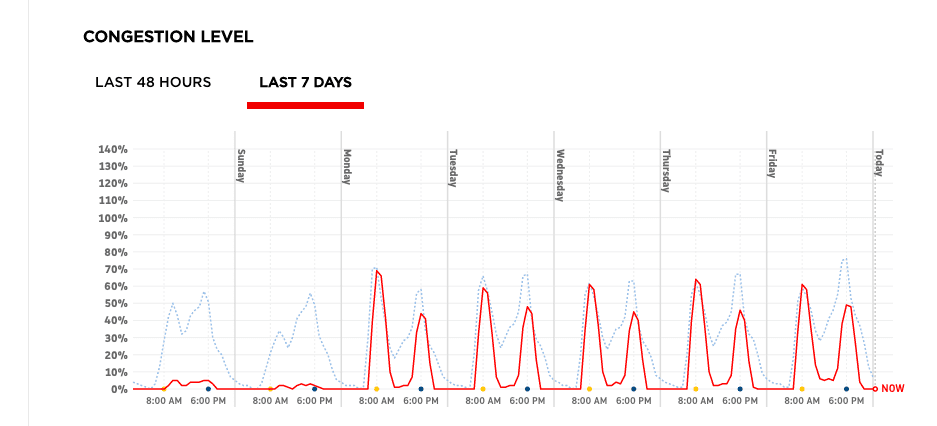
Important to remind your clients that traffic will resume as the virus abates. It has in China. Here’s a graph showing congestion in China for the last week. The red line is last week’s traffic in Bejing The dotted blue line is the average for all of 2019. You can see that the morning rush hour is back to normal and the evening rush hour is 80% of normal.

Source: Tomtom.com Bejing Traffic
[wpforms id=”9787″]
Paid Advertisement


