


By Norm Chait, Director of Out of Home Product/Sales at Ubimo, a quotient brand.
It has been almost a year since Ubimo, a Quotient brand, launched the OOH COVID Dashboard. This tool tracks movement around street-level and place-based out-of-home (OOH) inventory in order to understand the impact of COVID-19 on foot traffic.
Throughout the year, movement patterns have shifted. We saw spikes in movement as people stocked-up on essentials at grocery stores in March, followed by decreases in the following months as shelter-in-place orders went into effect. By summertime, movement around OOH started to rise, but the recovery was dependent on the inventory category. Foot traffic around OOH at doctor’s offices, grocery stores, convenience stores and restaurants recovered, with movement rates closer to or even above pre-COVID levels. In other categories, like airports, gyms, malls, salons and college campuses, movement around OOH remained below pre-COVID levels.
Let’s explore the nuances of the data and how it effects OOH advertising.
Trend 1: Stocking Up
One of the initial reactions to COVID-19 was stocking up on groceries before shelter-in-place orders went into effect. Our data shows that for the weeks of 3/9/20 and 3/16/20 foot traffic around OOH in or near grocery stores increased above pre-COVID levels.
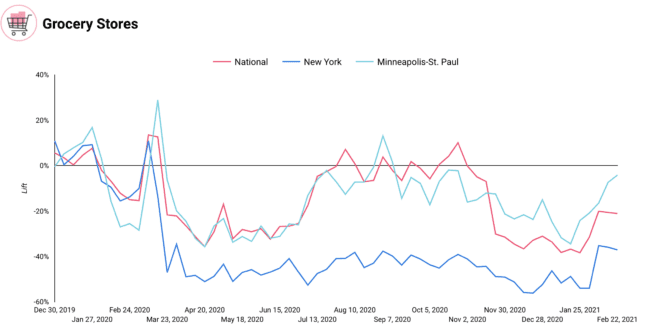
Of course, these reactions varied by DMA. New Yorkers stocked up earlier, with movement around OOH at grocery stores increasing to 41.5% above pre-COVID levels the week of March 9th. Minnesotans went to the grocery store in increased numbers the week of March 16th, with movement around grocery store OOH media 45.8% above pre-COVID levels.
After those spikes, movement around OOH at grocery stores decreased below pre-COVID levels in most DMAs. However, our research shows that while trips to the store may be limited in frequency, overall grocery sales are higher than pre-COVID levels and consumers are spending more per trip. Additionally, eight out of 10 grocery store shoppers view OOH advertising (Ubimo Internal Reporting May-July 2020). To reach these consumers as they make critical purchasing decisions, brands and advertisers can use OOH advertising in-store or on the way to the store.
With this insight, Consumer Product Goods (CPG) and grocery retailers seeking to connect with consumers at essential services and businesses could drive greater adoption and utilization of OOH as part of their COVID-proof advertising strategies. This insight helped drive greater adoption and utilization of OOH by CPGs and grocery retailers, and those seeking to connect with consumers at essential services and businesses.
Trend 2: Summer in the Sun
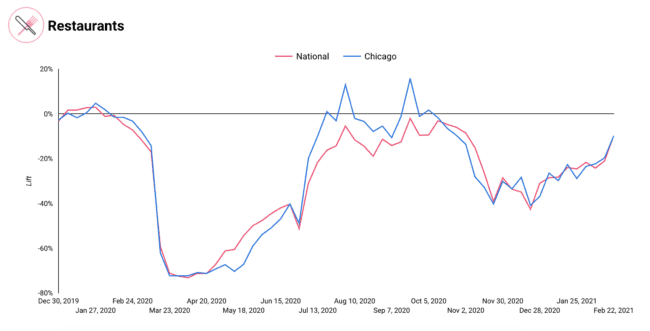
The summer months brought increased movement as people got outside to enjoy the outdoors and complete errands in COVID-19 friendly ways. Following a period of shelter-in-place, which decreased movement, foot traffic first increased above pre-COVID levels the week of July 6.
Popular summer destinations included restaurants—since people could enjoy outdoor dining in many DMAs. In Chicago, people embraced the outdoor dining scene, leading to increased movement around OOH media at restaurants. During some weeks, foot traffic even increased above pre-COVID levels at restaurants in Chicago. For example, the week of August 3rd, movement reached 13.0% above pre-COVID levels.
DMA level insights, like those about increased movement to restaurants in the summer, can inform campaign strategies as brands choose how to allocate OOH campaign budgets.
Trend 3: Black Friday Rush
While, categorically, mall traffic has dropped during the pandemic, we observed that during the key periods of Black Friday and Christmas Week, movement did increase. For example, during the week of December 14th, movement around OOH media at malls around the country increased 15.1% compared to the previous week.
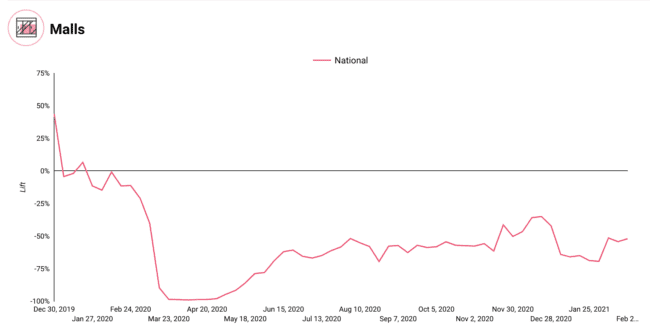
This insight shows that advertisers can reach their customer in key moments, like holiday shopping, using place-based OOH even during COVID-19.
Looking Ahead
With the vaccine rollout underway, foot traffic will continue to fluctuate across the board. Retailers and pharmacies offering the vaccine may see impacts to their movement levels. As the vaccine rollout continues and more people are able to safely go about their daily activities, movement around OOH advertising for other categories, like restaurants, malls, salons and more, will also increase.
This presents an opportunity to integrate OOH as an extremely effective part of any advertising campaign. Where to start? With the Ubimo Dashboard, you can actively monitor recovery by category and DMA to inform your advertising strategy – and ultimately, ensure you are accurately targeting your consumers at the right place and time as traffic experiences its uptick.
Methodology: To conduct this analysis, Ubimo is analyzing movement around 340k+ OOH street- level properties nationwide with a radius of 0.05 miles and 38k+ Place-Based OOH properties nationwide with a radius of 0.01 miles and dwell time limits applied. Lift is calculated by taking the percent change in visitors observed compared to the baseline week-over-week. The baseline is calculated based on average visitors observed by DMA between the weeks of 12/30/19 and 2/17/20. This independent analysis is based on Ubimo’s location intelligence platform. Ubimo data is anonymized and aggregated.
[wpforms id=”9787″]
Paid Advertisement