


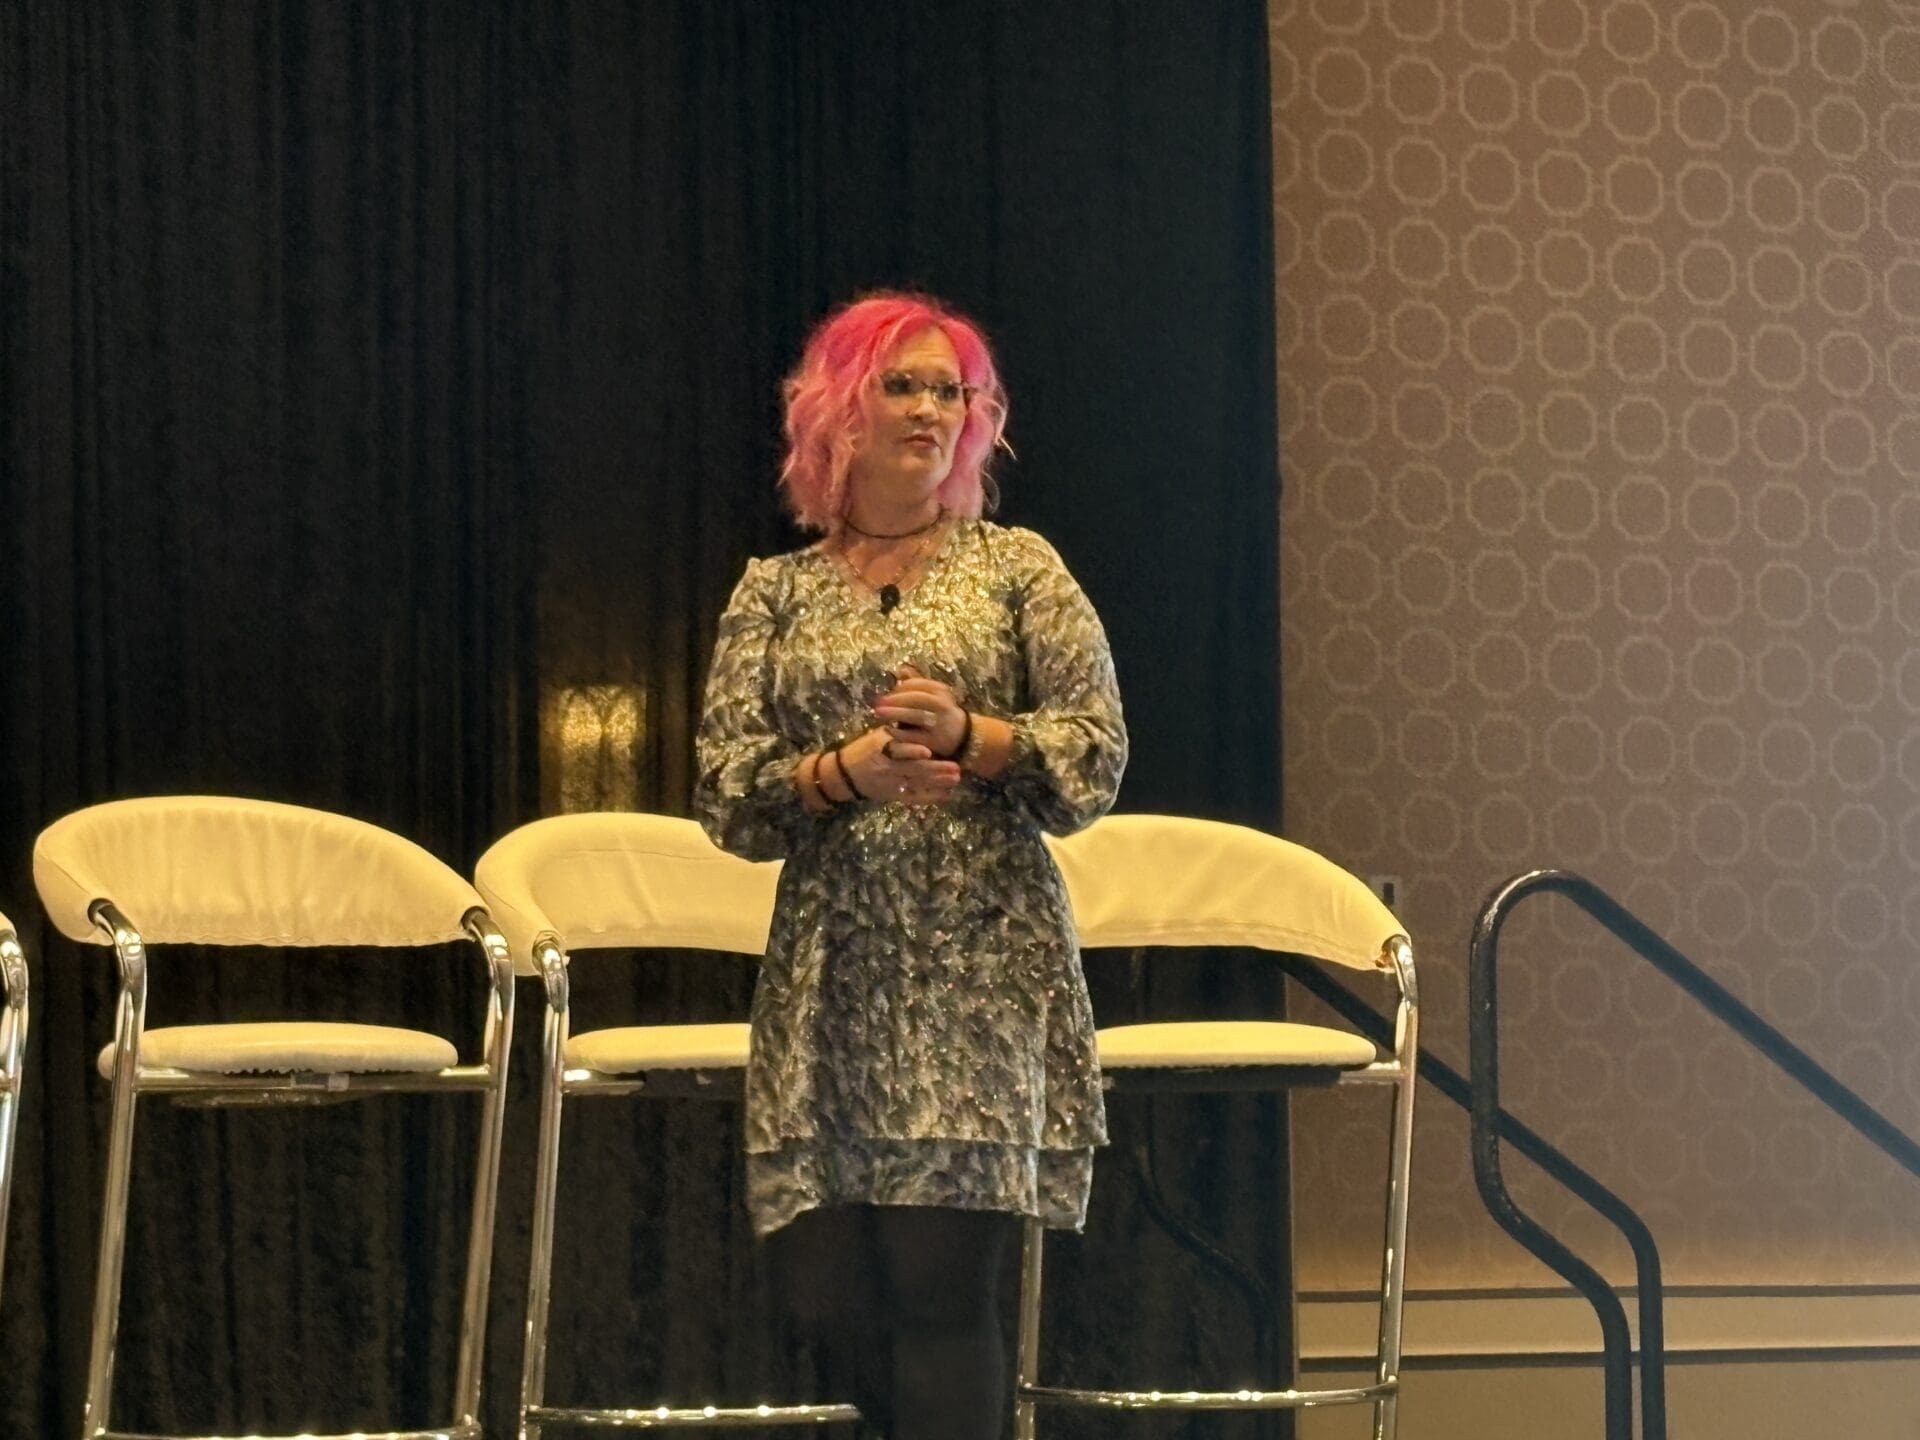
At last week’s IBO conference accounting technologist Liz Scott talked about the single most important accounting change operators can make and how AI is making it possible. Here’s a summary of her talk
You drive past a board on the highway and feel proud — that feeling might be misleading.
That’s exactly the trap. You see your board up on the highway and you think, that’s mine. It looks great. But just because it looks good doesn’t mean the numbers make sense. Often the financial reality is hidden — the lease terms, the actual occupancy, the per-board costs. Meanwhile, the board down the street that’s harder to see, set back a bit, less impressive visually? That one might be making you significantly more money. The board that impresses your friends is not always the board that’s working hardest for you.
Most billboard operators don’t look at per board profit.
What I see is blending. Operators know their gross revenue for the year. They know their net. They might even know which two months performed best. But they’re averaging across everything — and when you blend, your best boards cover for your worst. You don’t see the board that’s dragging your margins down. You don’t see the lease that’s quietly eating you alive because it’s grown to 44% of that location’s monthly revenue. That board is a $13,000-a-month problem hiding inside a healthy-looking annual report.
The lease ratio to watch
If any board’s lease cost exceeds 40% of its monthly revenue, that’s a red flag that should surface automatically in your reporting — not surface at year-end when you’re comparing notes with your accountant. Billboard Insider comment: lease costs should be 15-20% of revenues for a roadside billboard plant. 30-40% only makes sense for an urban billboard with huge revenues.
What numbers should every operator be tracking per board, at minimum?
At a minimum: monthly revenue, occupancy rate, lease cost and lease ratio, utilities — which vary dramatically between digital and static — taxes and permits broken out to that location, maintenance costs, commissions, and net profit. Every single one of those, per board. Not rolled up. Not blended. The occupancy number is particularly urgent — if you’re waiting to notice that a board has dropped to 50 or 60 percent, you’re already behind. You’re already feeling it. You need to see it daily so your sales team can respond before it becomes a crisis. The operators who grow fastest over the next five years won’t be the ones with the most boards. They’ll be the ones who understand their boards best.
Ad rates and lease negotiations should reflect a board’s performance
Think about a board where an apartment complex went up nearby and rerouted traffic to that road. The traffic count on that face has gone up meaningfully — but if you’re not watching it, you don’t know to renegotiate your rates upward. Conversely, if a highway exit that used to drive traffic past your board has changed, and you can see that occupancy has softened, you have a data-backed reason to go back to your landowner and negotiate the lease down. Without that visibility, you’re walking into both conversations blind. And over the life of a lease, that’s real money — a single board on an $8,000-a-month contract over ten years approaches a million dollars. Every underperforming month compounds.
QuickBooks tip
If you’re on QuickBooks Plus or Advanced, you have access to both class tracking and project tracking. Project tracking is newer — it has built-in profitability dashboards and lets you separate out payroll, maintenance, and billing per location. Most operators don’t know it exists.
Everyone is talking about AI. Is it actually useful for billboard operators right now, or is it hype?
It’s genuinely useful — but only if your data is structured. Think of AI like a very smart junior analyst who just joined your company. They’re capable. They work fast. But they don’t know your business yet. The more context you give them, the better their output. If you feed an AI a messy collection of spreadsheets with broken formulas, it gives you a generic answer. If you feed it clean, per-board data structured by location, face, and spot, and you tell it the KPIs that matter in this industry, it can start identifying trends you’d never catch manually. Which boards have lease ratios climbing toward the danger zone. Which markets are underperforming relative to traffic data. Where your pricing hasn’t kept up with demand. On the security side, use paid enterprise versions of these tools — Claude, Copilot, Gemini — not free tiers. And turn on the setting that prevents your data from being used for model training. Your financial data is private and should stay that way.
To receive a free morning newsletter with each day’s Billboard insider articles email info@billboardinsider.com with the word “Subscribe” in the title. Our newsletter is free and we don’t sell our subscriber list.
Paid Advertisement